Why Cosmetic Surgery Statistics Disagree, and Which to Trust
Cosmetic surgery statistics from the two leading US bodies do not agree, and the gap is large. The Aesthetic Society...


The latest news and expert insights for aesthetic practices.
Published on: October 28, 2026
Go Back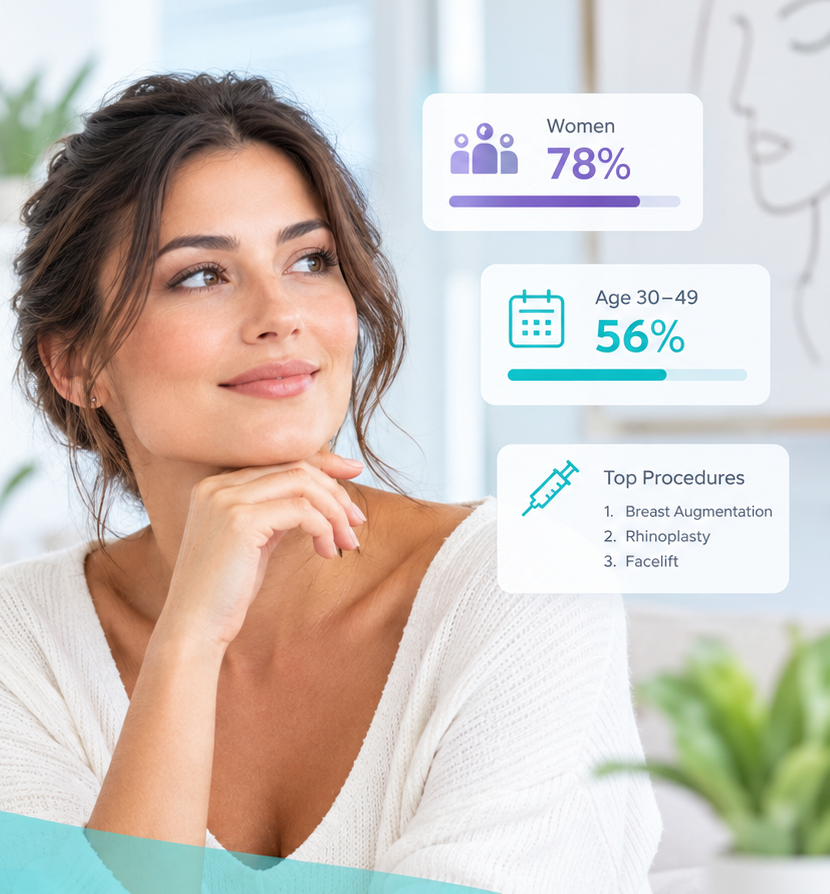
Aesthetic surgery patient demographics are more concentrated than most practice marketing assumes. According to The Aesthetic Society’s own National Databank, 40% of surgical patients are aged 35 to 50, and 93.4% are women. The under-35 group everyone markets to accounts for less than a fifth of procedures.
If your advertising is built around a younger patient and your waiting room is not, the data explains the gap.

The Aesthetic Society publishes an annual Aesthetic Plastic Surgery National Databank, compiled with CosmetAssure. The most recent full report covers 2023 and counts 1,671,147 surgical procedures, up 2.9% on 2022 and 10.2% on 2019.
Unlike most figures circulating about aesthetic surgery patient demographics, these come from procedure records rather than a consumer survey, which makes them a description of who actually had surgery rather than who said they were interested.
| Age band | Share of surgical procedures |
|---|---|
| Under 17 | 0.9% |
| 18 to 34 | 19.5% |
| 35 to 50 | 40.0% |
| 51 to 64 | 27.7% |
| 65 and over | 11.9% |
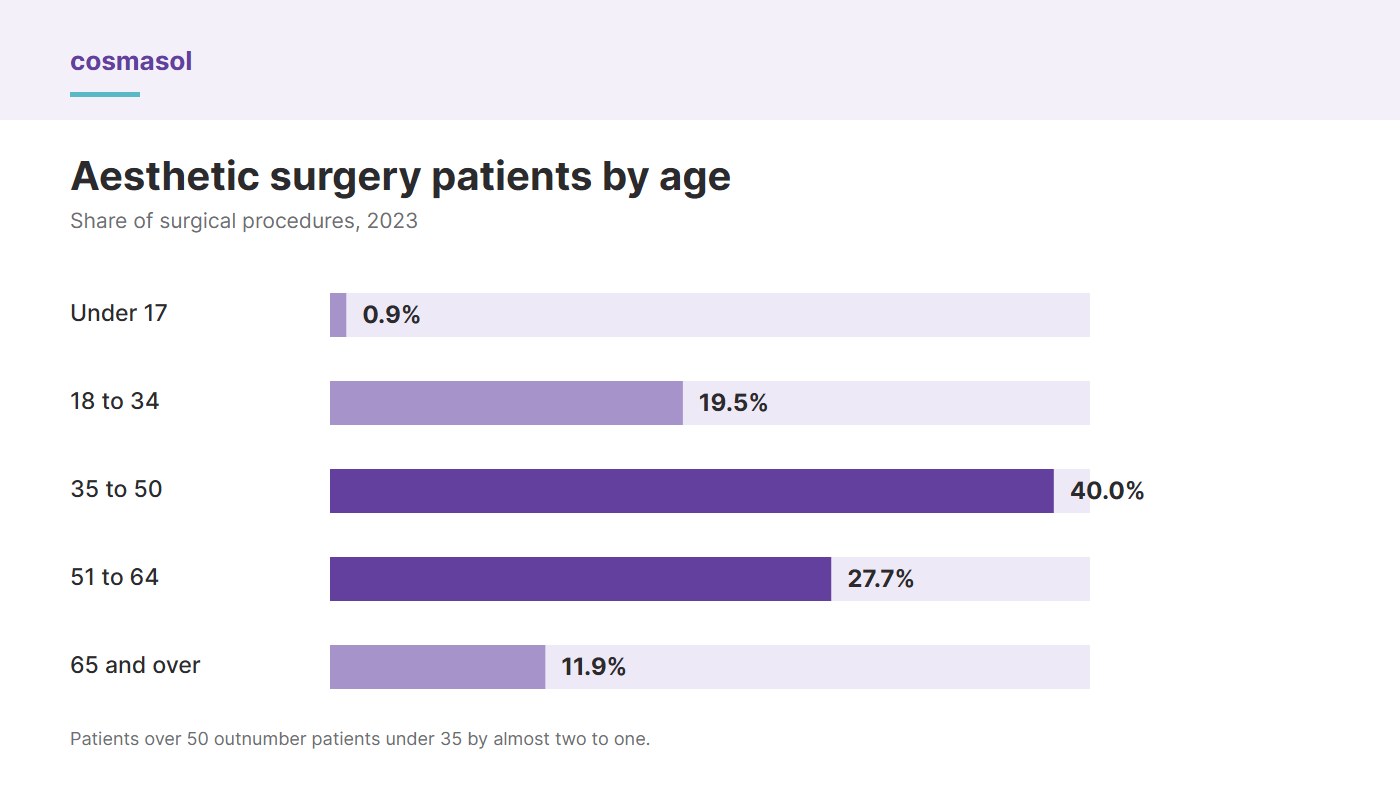
Two things stand out immediately in the aesthetic surgery patient demographics.
The core is 35 to 50. Four in ten procedures. This is the patient with established income, often post-children, making a considered purchase after months of research.
The over-50s outnumber the under-35s almost two to one. Combined, the 51-to-64 and 65-plus groups account for 39.6% of procedures against 19.5% for 18-to-34. Yet most aesthetic marketing imagery, and most social media strategy, is aimed squarely at the smaller group.
That mismatch between marketing and aesthetic surgery patient demographics has an operational consequence. A 55-year-old researching a facelift behaves differently from a 28-year-old researching augmentation. She is more likely to call than to send an Instagram message, more likely to research for longer, and considerably more likely to be lost if the phone goes unanswered.
| Patients | Procedures | Share |
|---|---|---|
| Female | 1,561,385 | 93.4% |
| Male | 109,762 | 6.6% |
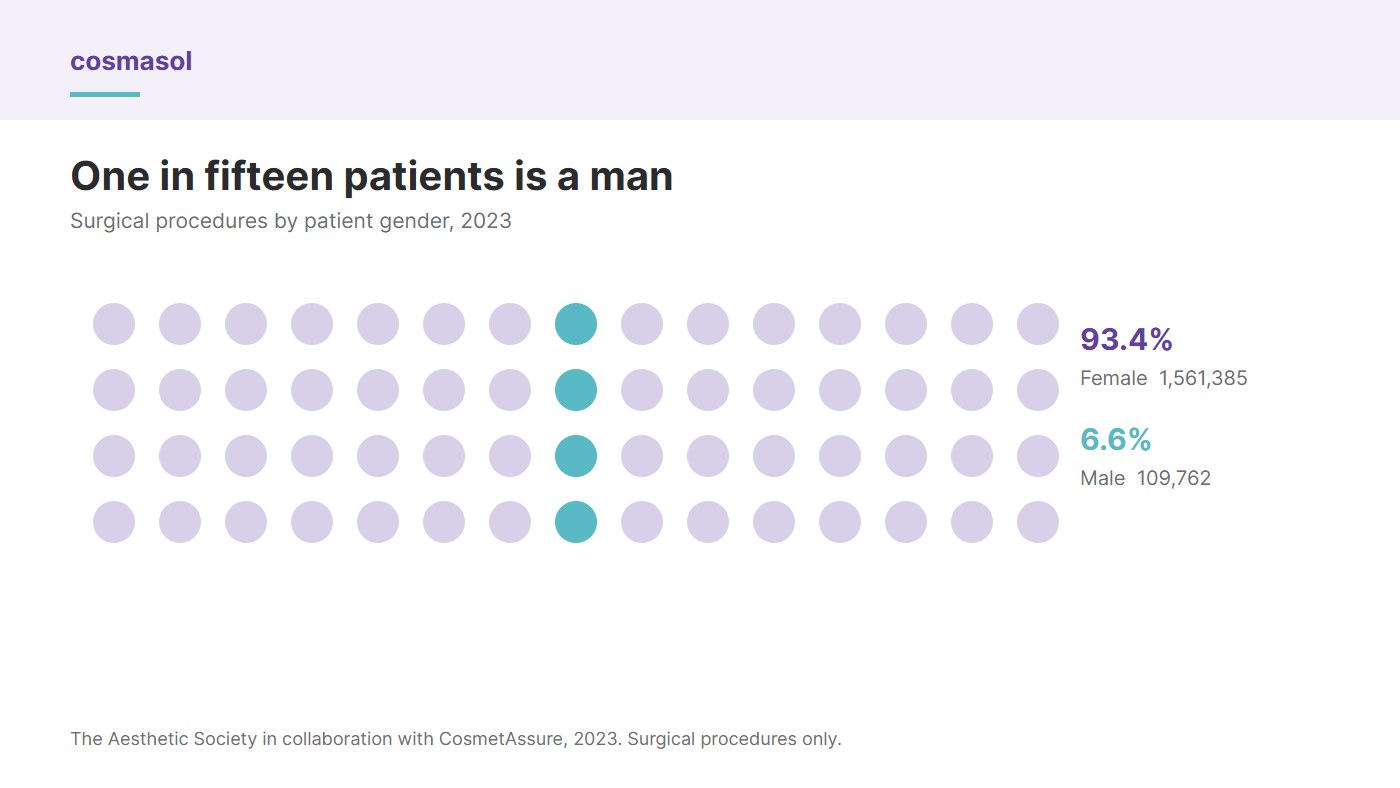
One in every fifteen aesthetic surgery patients is a man, a detail the headline aesthetic surgery patient demographics tend to bury. That is 109,762 procedures in a single year, a larger market than most practices realise, and it is served almost entirely by practices whose websites, photography and intake scripts assume a female patient.
This is not an argument for rebuilding your brand around male patients. It is an argument for checking whether a man who calls your practice encounters anything that tells him he is in the wrong place.
There is a straightforward reason aesthetic surgery patient demographics skew older than the imagery suggests. Surgery is expensive, and the ages with the most disposable income are not the ages with the most social media reach.
A facelift at a mean advertised price of around $14,600 is simply not a purchase most 26-year-olds are making. The procedures that dominate the 35-to-64 range, abdominoplasty, breast lift, eyelid surgery and facelift, are the higher-value ones. So the older half of the patient base is not just the larger share of procedures, it is very probably the larger share of revenue too.
Younger patients are more visible, not more numerous, which is why observed aesthetic surgery patient demographics rarely match a practice’s social feed. They post more, tag more and generate more engagement, which makes a practice’s social feed a poor mirror of its actual patient mix.
National aesthetic surgery patient demographics are a benchmark, not a description of your practice. These four comparisons take an afternoon and tell you where you actually differ.
If your mix differs sharply from the national aesthetic surgery patient demographics, that is not automatically a problem. A practice built around one age group can be perfectly healthy. It is only a problem when the difference is accidental.
Aesthetic surgery patient demographics are usually quoted as a marketing curiosity. They are better read as a capacity planning input.
Read through the lens of coverage, the aesthetic surgery patient demographics say something simple. The 35-to-50 group is working. They call during lunch breaks, in the evening, and at weekends, which is precisely when most practices are least able to answer. The 65-plus group, at 11.9% of procedures, is more likely to call during business hours but far less likely to persist through a phone tree or leave a voicemail.
In both cases the failure mode is the same, and it is not a marketing failure. It is a coverage failure, and it is the subject of our post on what after-hours patient calls actually cost.
Cosmasol builds AI Digital Agents for aesthetic and plastic surgery practices. The AI Calling Agent answers the phone when the front desk cannot, and the AI Website Chatbot and AI Social Media Chatbot cover website and Instagram inquiries, each trained on the practice’s own procedures and policies. The point is coverage across the channels different age groups actually use, rather than assuming every patient arrives the same way.
35 to 50. That band accounts for 40.0% of surgical procedures according to The Aesthetic Society’s 2023 National Databank, with 51-to-64 next at 27.7%.
6.6%, or 109,762 procedures in 2023, against 1,561,385 for women.
Not in the surgical figures. The 18-to-34 group accounts for 19.5% of procedures, while patients over 50 account for 39.6% combined. The picture may differ for injectables, which this dataset does not cover.
The Aesthetic Society recorded 1,671,147 surgical procedures in 2023, up 2.9% on 2022 and 10.2% on 2019.
Only as a benchmark. The figures are national and cover reporting practices. Compare them against your own patient records rather than assuming they describe your catchment.
Different age groups favour different channels and tolerate different amounts of friction. Older patients lean towards the phone and are less likely to leave a voicemail, so an unanswered call costs more in that segment.

Cosmetic surgery statistics from the two leading US bodies do not agree, and the gap is large. The Aesthetic Society...
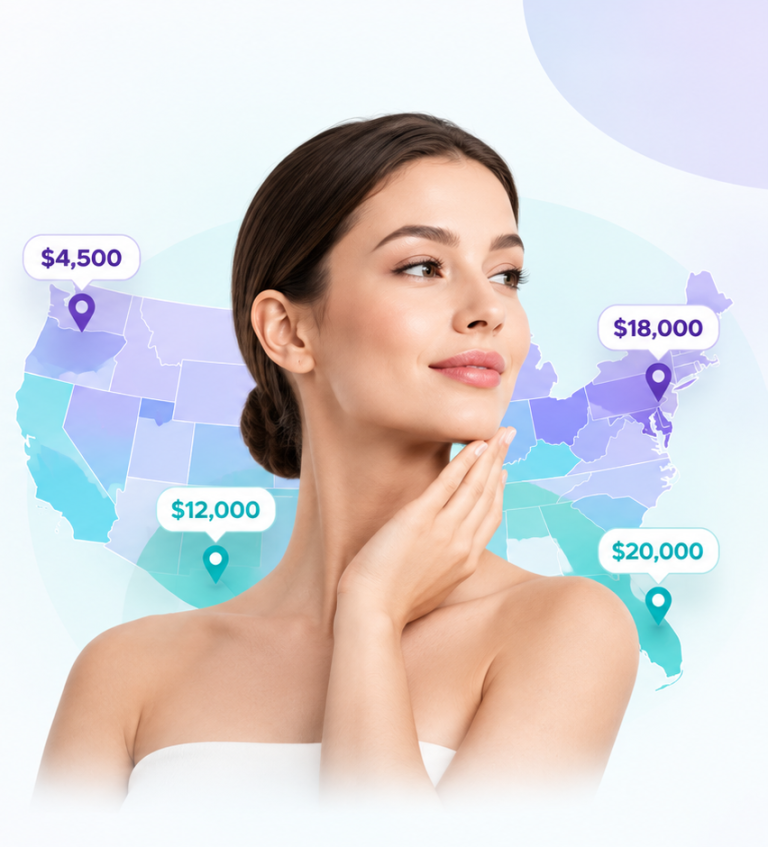
Cosmetic surgery prices by state vary far more than most practices realise. Peer-reviewed analysis published in 2026 found average liposuction...
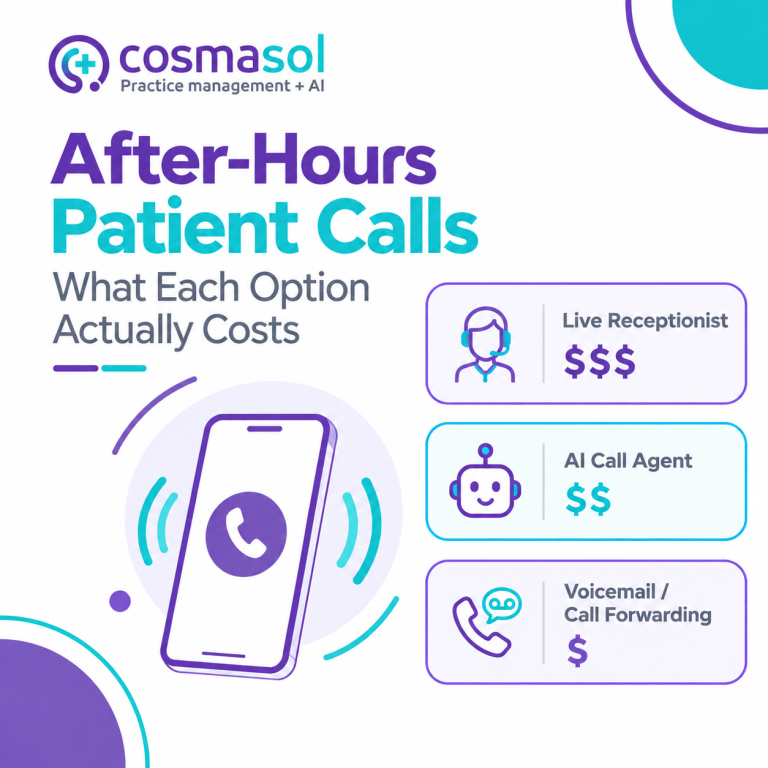
After-hours patient calls are the inquiries that arrive once the front desk has gone home: evenings, weekends and holidays. Most...