AI Chatbots for Med Spas: Do They Actually Convert?
Does a med spa chatbot actually convert? See what the research shows, why many setups fail, and how to test...


The latest news and expert insights for aesthetic practices.
Published on: October 26, 2026
Go Back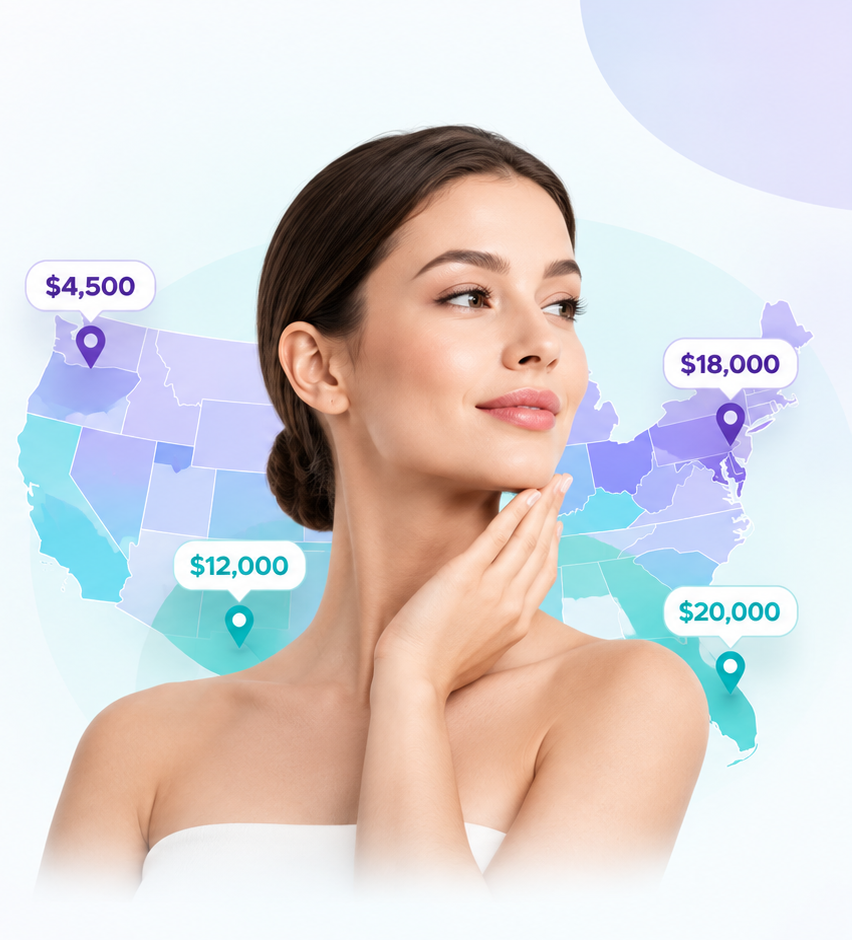
Cosmetic surgery prices by state vary far more than most practices realise. Peer-reviewed analysis published in 2026 found average liposuction advertised at $13,450 in Michigan and $3,100 in Atlanta, a difference of more than four times for the same procedure name. A facelift ranged from $7,300 in Chicago to $45,200 in New York.
Those cosmetic surgery prices by state are advertised figures, not audited invoices, and that distinction matters. But the spread is real, it is documented, and it changes how your practice should handle the first question almost every caller asks.
The study appeared in Aesthetic Surgery Journal Open Forum, the open-access journal of The Aesthetic Society, in June 2026. Güler and colleagues collected advertised prices for six procedures across 100 US metropolitan areas, producing 600 city-procedure observations, then compared them against state income and GDP data from the Bureau of Economic Analysis.
This is the largest published look at cosmetic surgery prices by state, and it is worth reading before you quote any national average to a patient.
| Procedure | Mean | Median | Lowest | Highest |
|---|---|---|---|---|
| Facelift | $14,639 | $13,200 | $7,300 | $45,200 |
| Abdominoplasty | $11,032 | $10,975 | $7,400 | $19,200 |
| Breast reduction | $10,139 | $9,285 | $5,150 | $20,200 |
| Rhinoplasty | $9,514 | $9,200 | $5,300 | $15,890 |
| Breast augmentation | $7,480 | $7,550 | $4,300 | $11,800 |
| Liposuction | $6,234 | $5,700 | $3,100 | $14,200 |
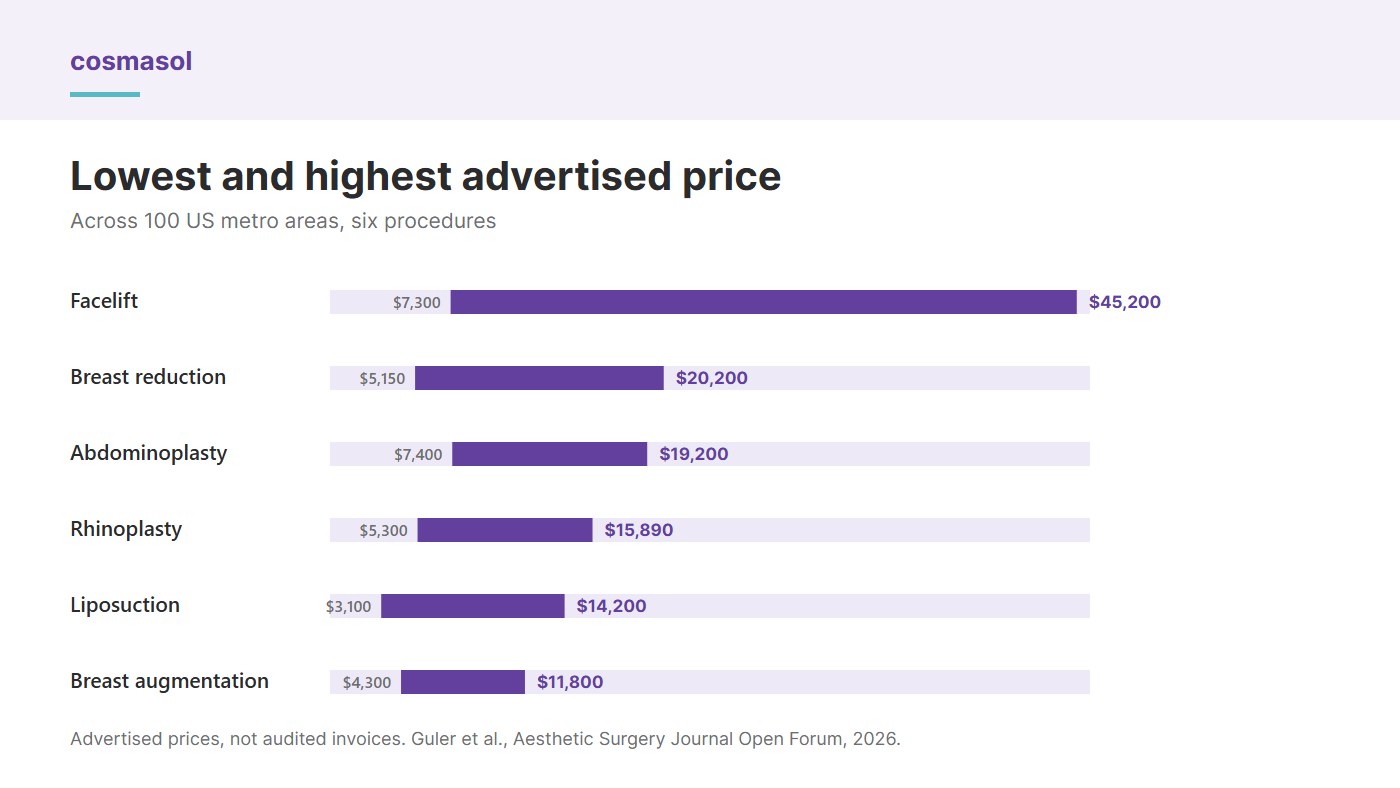
Read cosmetic surgery prices by state as a gap rather than an average: look at the lowest and highest columns rather than the mean. Facelift pricing varies by a factor of six. Liposuction varies by more than four. These are not small regional adjustments, they are different businesses operating under the same procedure name.
| Most expensive | Mean price | Least expensive | Mean price |
|---|---|---|---|
| New York | $13,182 | New Mexico | $6,792 |
| Massachusetts | $12,006 | Kansas | $7,565 |
| Oregon | $11,512 | Illinois | $7,641 |
| Colorado | $11,435 | Indiana | $7,793 |
| Michigan | $11,025 |
Some of this variation in cosmetic surgery prices by state is predictable. New York and Massachusetts are expensive places to run a surgical practice. Some of it is not. Oregon and Michigan sit near the top, Illinois sits near the bottom, and Chicago produced the cheapest facelift in the dataset while New York produced the most expensive.
The authors found cosmetic surgery prices by state correlate moderately with income. Per capita personal income gave a correlation of 0.529, GDP per capita 0.482, both statistically significant across 33 states. Income explains roughly 28% of the variation. The remaining 72% is something else: competition, specialisation, overheads, and what each market has learned to tolerate.
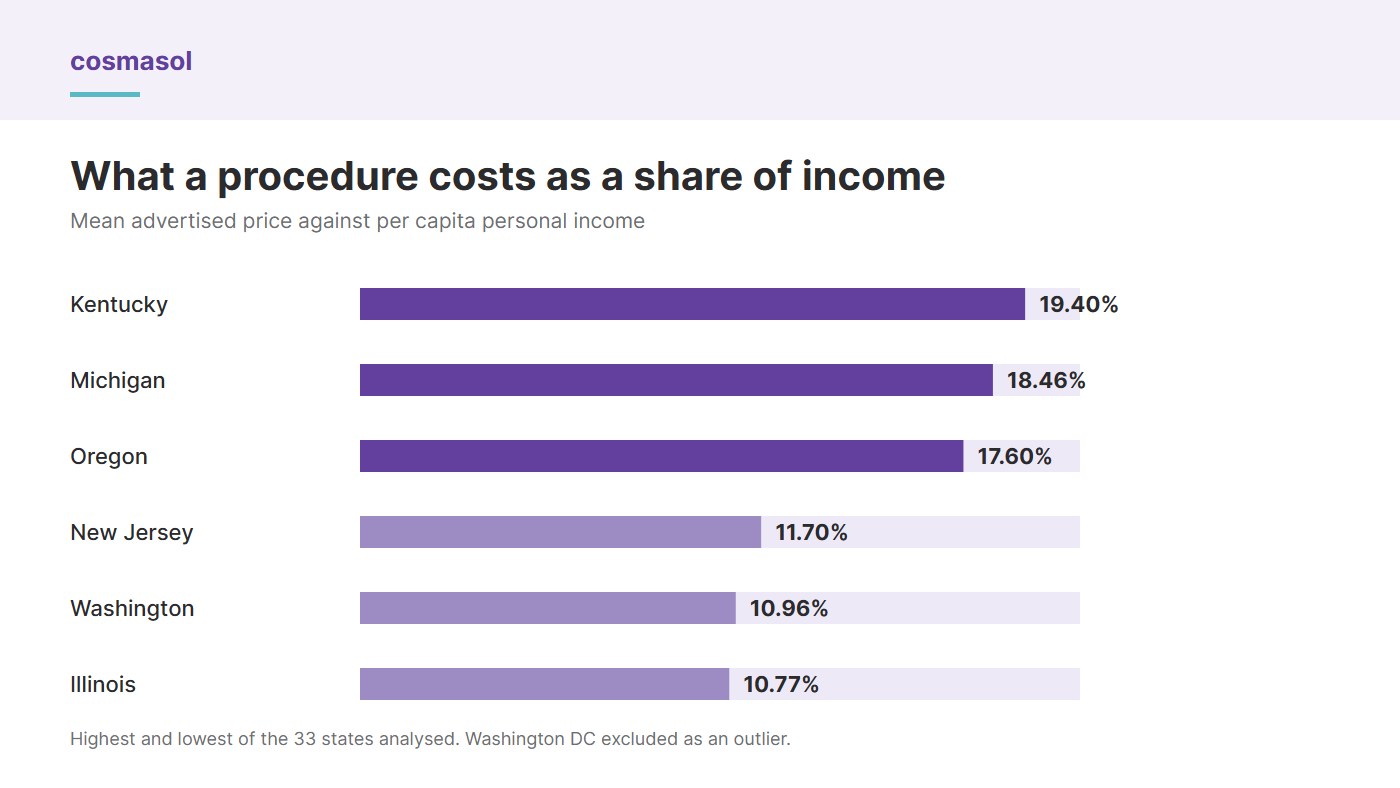
The most useful figure on cosmetic surgery prices by state is not a price at all. It is what a procedure costs as a share of what people in that state earn.
| State | Price as share of per capita income |
|---|---|
| Kentucky | 19.40% |
| Michigan | 18.46% |
| Oregon | 17.60% |
| New Jersey | 11.70% |
| Washington | 10.96% |
| Illinois | 10.77% |
A patient in Kentucky is being asked for nearly a fifth of a year’s average income. A patient in Illinois is asked for about a tenth. Those two people are having completely different internal conversations when your coordinator quotes a number, even if the number itself is similar.
If your practice sits in a high-burden state, price objections are not a sign your coordinator is handling the call badly. They are a structural feature of your market.
Cosmetic surgery prices by state explain a daily problem at the front desk. Almost every new patient inquiry contains some version of “how much does it cost?” The pricing data explains why that question is so hard to answer well.
This is also why after-hours coverage matters more in aesthetics than in most of medicine. A price question that goes to voicemail at 8pm is answered by the next practice on the list. Our post on what missed patient calls cost works through that arithmetic.
Income explains about 28% of cosmetic surgery prices by state. The authors are explicit that the rest is unaccounted for, which leaves roughly 72% of the spread to factors the dataset does not measure. From what practices report, four of them do most of the work.
The practical takeaway is that a competitor charging 30% more than you is not necessarily better, and one charging 30% less is not necessarily cheaper. Until you know what each quote includes, cosmetic surgery prices by state are not comparing like with like.
Worth remembering where this dataset came from. These were advertised prices, scraped from a public listings platform. That is also roughly what a patient sees when they research cosmetic surgery prices by state before picking up the phone.
So a patient arrives at your consultation having already seen a range with a fourfold spread in it, often without any explanation of what each figure covers. They are not being difficult when they question your fee. They are trying to make sense of a market that presents itself inconsistently.
Practices that handle this well tend to do the same two things: they give a number early, and they say plainly what it includes. Both are easier when whoever answers the phone has the same information the surgeon does.
None of that undermines the headline on cosmetic surgery prices by state. A fourfold spread survives a lot of methodological caution.
Cosmasol builds AI Digital Agents for aesthetic and plastic surgery practices. The AI Calling Agent, AI Website Chatbot and AI Social Media Chatbot answer inquiries across phone, website and Instagram, trained on the practice’s own procedures, policies and pricing guidance, so a price question gets a consistent answer rather than a different one depending on who picks up. Anything clinical or unusual is escalated to a person.
Learn how the Cosmasol AI front desk picks up after-hours calls and replies to every chat and DM.
New York, at a mean advertised price of $13,182 across six common procedures, followed by Massachusetts at $12,006. New Mexico was the least expensive at $6,792.
Substantially. Published 2026 analysis found mean liposuction advertised at $13,450 in Michigan against $3,100 in Atlanta, and facelift pricing from $7,300 in Chicago to $45,200 in New York.
Partly. Per capita income correlated with price at 0.529 and GDP per capita at 0.482, both significant. Income explains roughly 28% of the variation, so most of the spread comes from other factors.
Kentucky, where the average procedure represents 19.40% of per capita personal income, followed by Michigan at 18.46%. Illinois was the most affordable at 10.77%.
The data supports giving at least a starting figure. When advertised prices vary this widely, patients who cannot find a number from you simply keep calling other practices until they find one.
No. They are advertised prices drawn from a commercial listings dataset, and bundling varies between listings. Treat them as a map of the market rather than a record of transactions.
Does a med spa chatbot actually convert? See what the research shows, why many setups fail, and how to test...
Choosing a med spa AI receptionist? Use this 10-point checklist to test accuracy, booking rules, handoffs, DMs, privacy terms and...
Your med spa front desk can't answer every call, DM and patient at once. See which 7 tasks to automate...